What is Geomatics?
When someone asks me what I do I say I’m an archaeologist. Then they usually say something along the lines of ‘have you dug any good sites recently?’ after which I admit I’m in the Geomatics department so don’t do digging as such. Their usual response to this is to look thoughtful for a few moments and say, ‘Geomatics...what exactly is that?’ I usually then come up with something vague about ‘survey, maps and stuff’ which leads to much sage nodding and at this point the conversation usually moves on. So here is my attempt to go into more detail, perhaps in future I can simply send them a link to this blog!
Geomatics is a relatively new term coined in the 70s and 80s to reflect the changes in the job of Surveyor to encompass much more. It is not only just survey but the whole process involved in making and analysing interactive maps using the latest technology. This includes techniques for collecting, processing, distributing, storing, analysing, and presenting spatial data, usually incorporating this data into a Geographical Information System (GIS). In archaeology the accurate recording of where we find things is crucial. Geomatics not only facilitates this essential task but can also create an added dimension by allowing plans to be analysed and viewed interactively. This visualisation of data can come in many forms, from the production of vector or raster mapping produced from data collected with the latest survey techniques, online webmap resources showing and compiling survey data alongside historical or geological mapping resources, to 3D models and assets produced using photogrammetry and laser scanning.
When is geomatics done and who for?
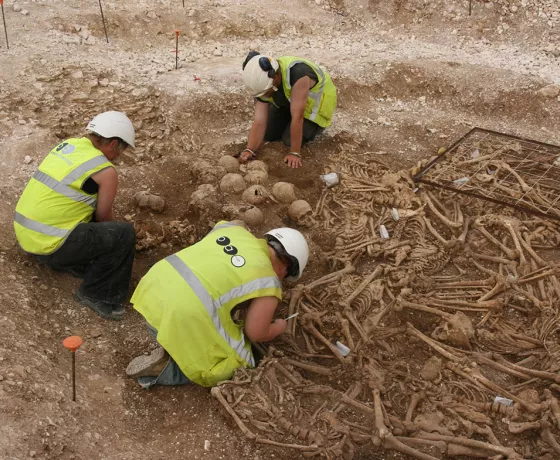
At OA we have had a dedicated Geomatics department since 2001 and have always shown an interest in innovation in applying geomatics to archaeology and using it to enhance what we do. Geomatics permeates pretty much every stage of an archaeological project, from initial desk-based assessments of what archaeology may be found on a particular site, non-intrusive techniques of survey, such as geophysics and aerial photography, initial evaluation and full-scale excavation, analysis of the results and publication, disseminating findings and showcasing results through public outreach and engagement, and finally archiving the spatial data for future generations. Accurate plans with good quality data have always been essential and as such our geomatics team are often first on a site and last off it. We also frequently provide technical knowledge and support to enable others in the organisation to help them view, interrogate, and present archaeological data.
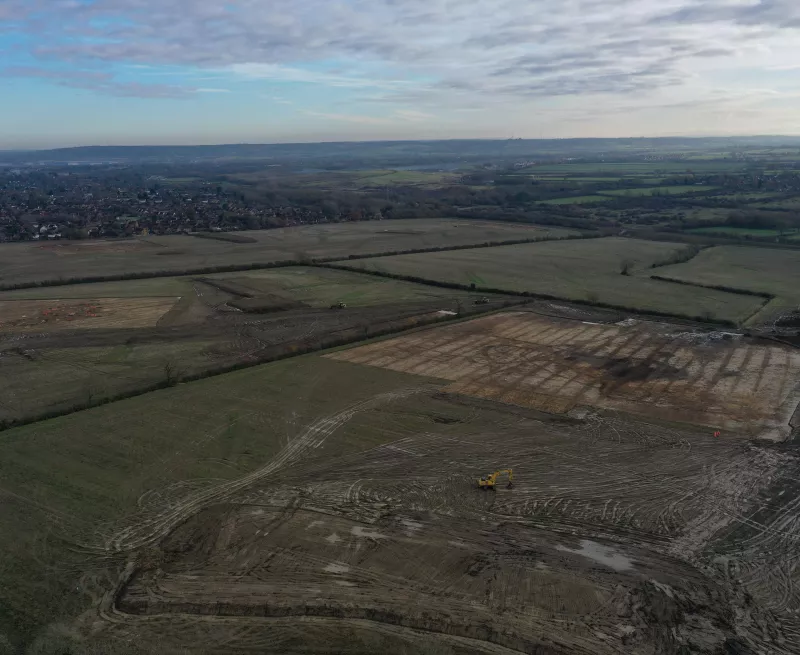
A good example of our role across the life cycle of a project is our work on the Lower Thames Crossing (LTC) scheme. Geomatics were involved right at the start, helping the client and appointed contractors to build their GIS resources for the scheme, alongside providing visualisations and analytical plans for their planning documents and applications. When fieldwork commenced, we undertook the spatial recording of the numerous different evaluation areas across the scheme, utilising our webmap workflow to visualise and provide access to the data as it was captured. Our work then continued into the post-excavation assessment stage, further envisaging the data by producing maps for reports and publications, 3D models for public outreach, alongside producing digital deliverables and archiving of data to help inform the next stages of the scheme.
What do we actually do?
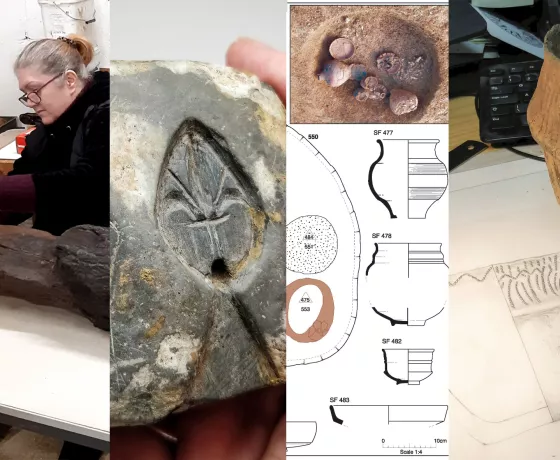
A typical week for most OA Geometricians will usually involve a mixture of site and office work. The start of a week may involve setting out excavation areas or evaluation trenches. Other field work could be anything from site data capture using survey equipment, photogrammetry using a pole-mounted camera or UAV (Unmanned Aerial Vehicle or Drone), metric building, earthwork or landscape survey. Data in the field is captured using a variety of techniques that may include laser-scanning, photogrammetry, GNSS (Global Network Satellite Systems, more commonly known by the American version, GPS), TST (Total Station Theodolite) or more traditional hand planning with a tape, pencil and paper that can be digitised later and added to the digital resource.
Office work may involve processing the captured data to bring it into a GIS, creating plans for use on site and figures for a report, or more complex spatial analysis. At Oxford Archaeology we have developed our own ‘webmap’ system that allows data to be processed and uploaded quickly so it is available to people digging on site to view on a mobile device such as a tablet or phone as soon as possible after it has been planned. Our webmaps are also a powerful tool across the company, as they allow staff from all departments to view and access the spatial data for a site or project as it is being undertaken, right through to the analysed and phased data used in publications and post-excavation assessments.
Our site survey and processing tasks can often be some of the most interesting to undertake, as we get to see the range of features and elements being excavated and recorded across sites. They allow us a privileged view of being able to see the interconnected nature and relationships between all the archaeology on a site and how it relates not only to itself but also the surrounding landscape, particularly on sites with multiple areas. Our current work on the A417 and Sizewell joint venture projects, alongside previous sites such as Newark, Windy Harbour, Innsworth, Oxford Westgate Centre and A21 scheme, are great examples of both rural and urban sites where we have been able to see and record a rich variety of archaeological features across multiple areas as they are uncovered and investigated.
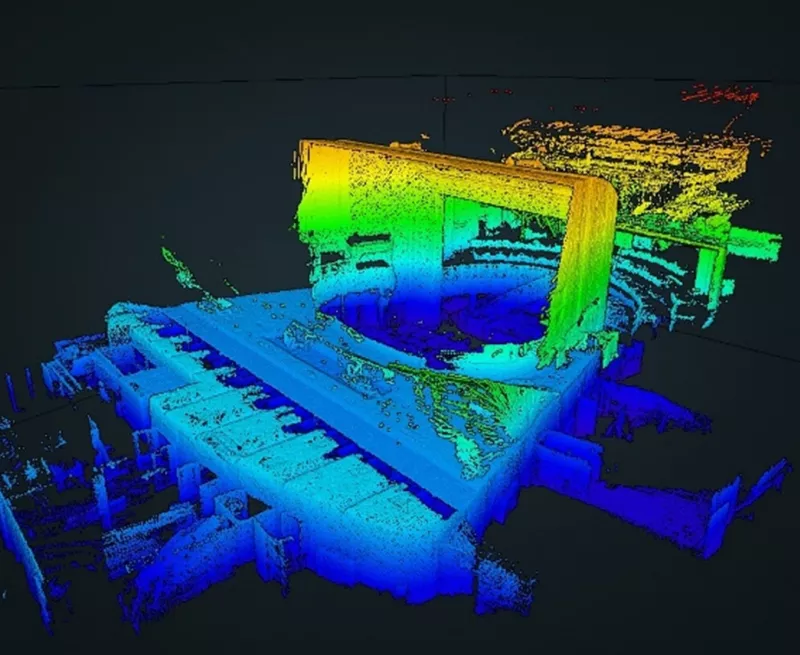
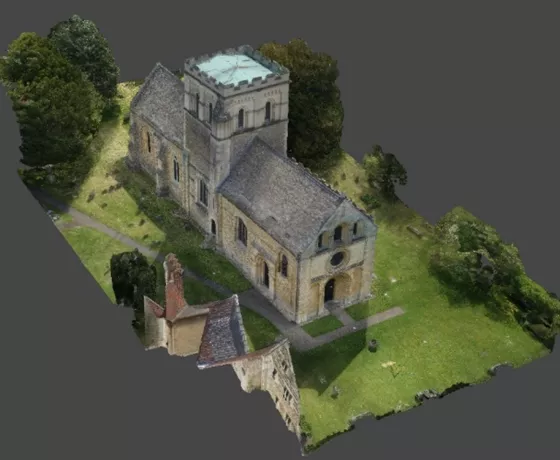
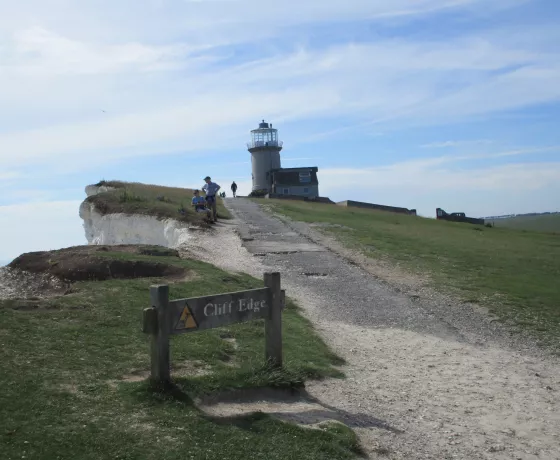
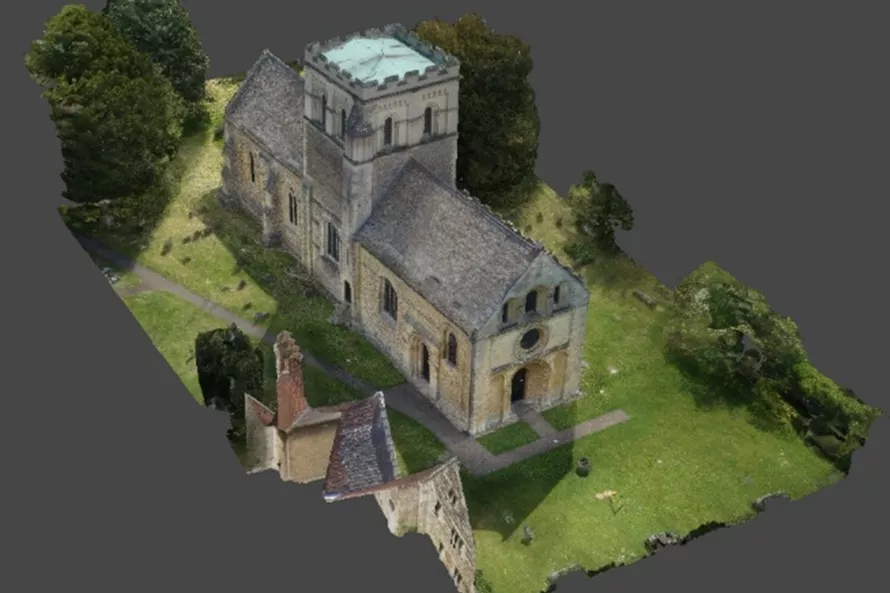
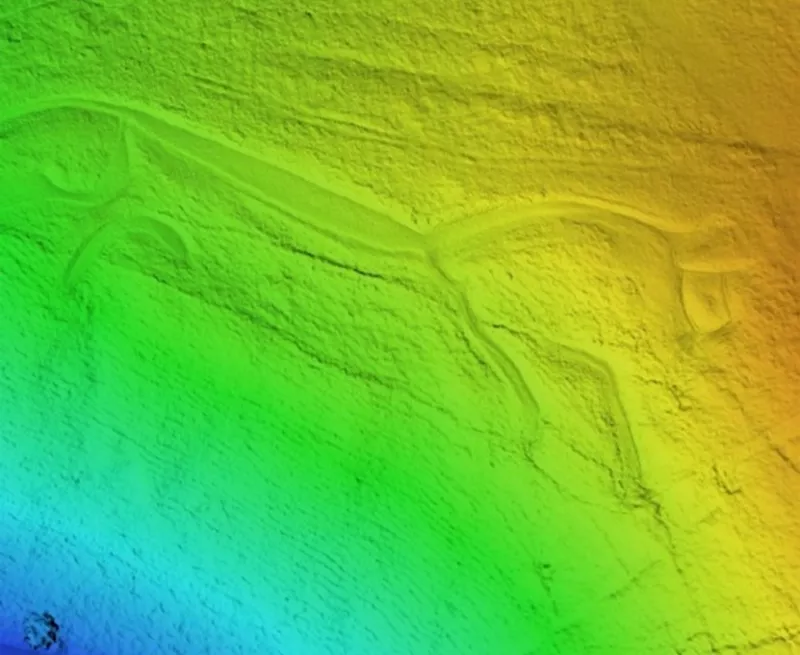
As mentioned above, alongside our site survey recording, we also utilise photogrammetry and laser scanning to undertake a variety of tasks, to produce both 3D models and record sites and archaeology. These range from onsite handheld and polecam photogrammetry jobs, to utilising UAVs to produce site wide orthophoto plans and DEM models, alongside laser scanning of buildings and built heritage to produce accurate scaled floorplans and digital reconstructions. By employing these techniques, we can produce 3D outputs which allow archaeology to be recorded and visualised in ways not possible in other ways. A recent example of this is work at the Uffington White Horse, where we undertook a UAV survey to produce a Digital Elevation Model (DEM) and top-down orthophoto to compare with outlines of the horse digitised from historic maps. Our work successfully showed that the horse had in fact been shrinking over the last nearly 100 years, which will now lead to future work to help restore the national monument to be closest to its former dimensions. We have also undertaken extensive laser scanning of buildings in collaboration with our Buildings Department colleagues on the HS2 North and Central sections, helping provide accurate floor plans and digital models of the buildings to be demolished as part of this project, providing an important record and resource of their condition and existence. Photogrammetric modelling and recording of features like the All Souls Chapel Reredos and Windy Harbour Neolithic midden are also other examples of where our 3D modelling has helped to record and analyse features and structures in new innovative ways.
Other posts in this collection
Explore with us all the different disciplines and specialist areas that make up our archaeological practice.